I put on some weight during my time in grad school, and this spring, I decided to do something about it. In April, I started using MyFitnessPal to track my food intake and exercise, and I run a net calorie deficit every day. Thankfully this seems to be working.
In May, I bought a Withings WS-30 wireless scale. When I first heard about this wifi scales, I thought they sounded like a gimmick, however the Withings has become a helpful tool in the weight loss process.
Every morning, I step on the scale and my weight is automatically broadcast to MyFitnessPal, Monitor Your Weight on iOS, and a text file in my Dropbox folder (via IFTTT and Withings’ API). MyFitnessPal adjusts my daily calorie limit by my weight, Monitor Your Weight is a great tool for visualizing progressing, and I use the text file to import a ggplot time series of my weight into Day One each month.
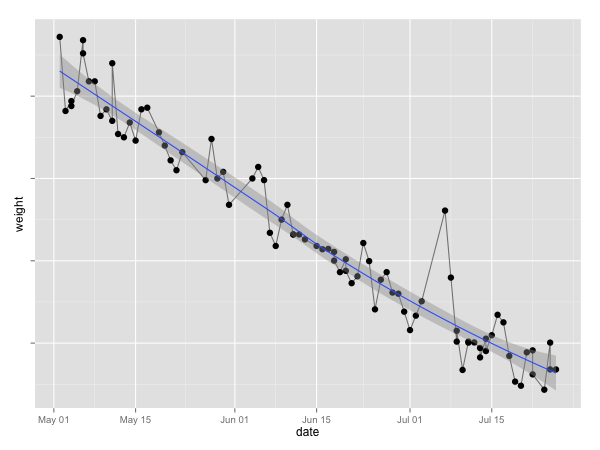
An interesting aspect of my weight time series is how noisy it is. (No doubt this is true for others as well.) On many mornings, my weight is up from the day before (despite a fairly consistent net caloric deficit). As you can see from the plot, my weight jumps up and down daily even though the overall trend is downward.

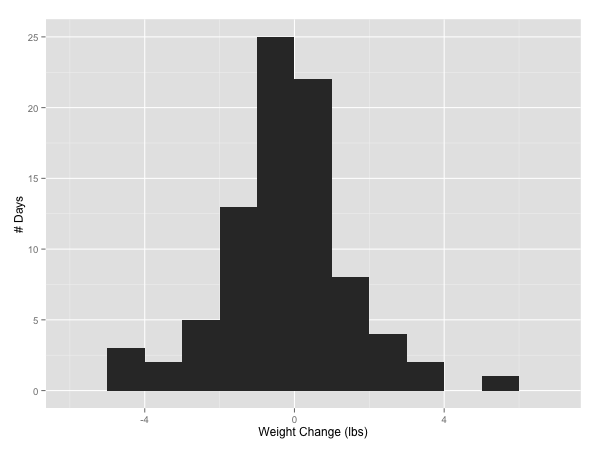
I have been wondering what percentage of days I actually lose weight, so I decided to find out. The plot below is a histogram of my weight change from day to day.1

The data appears nearly Gaussian around 0! (In fact, the p-value on the Shapiro-Wilk normality test is 0.11, arguably not small enough to reject the null hypothesis that the data are not normally distributed.) Fortunately the mean of the differences is actually about -0.24 (pounds/day), and my progress is downward.
In total, I lost weight on 48 days, gained on 33, and stayed the same on 4% of the days. That means I’ve steadly lost weight while only moving down on 56% of days. I guess I don’t need to be depressed every time my weight jumps up slightly….
This isn’t 100% true. I’m hiding the fact that I missed weighing-in on some days. ↩︎