Back in July, I posted some analysis of my attempt at weight loss. Now that I’m four months further down the line, I thought I’d post a follow-up.
I continue to be fascinated with how noisy my weight time series is. While I’ve continued to lose weight over time, my weight goes up two out of five mornings.
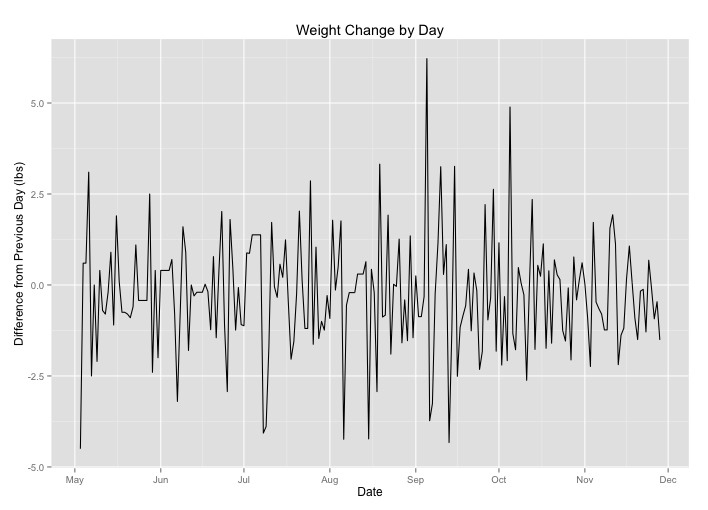
Here’s a plot of the time series of my change in weight. Note how often the change is positive, i.e. I appear to have gained weight:
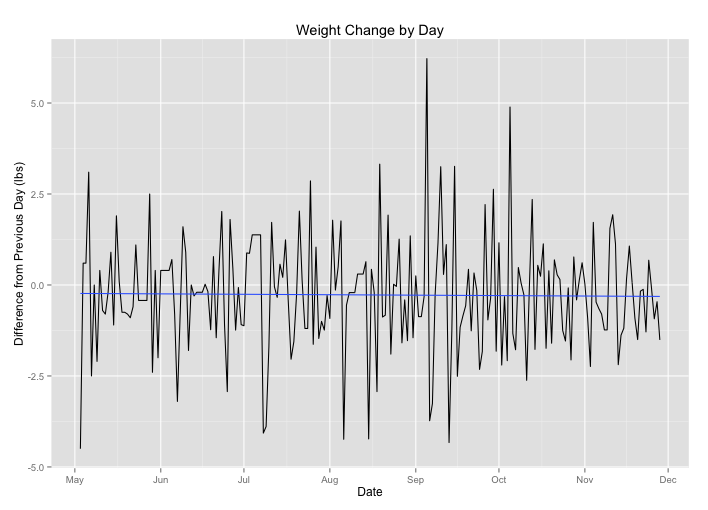
This volatility can hide the fact that I’m making progress! When I put a regression line through the points, you can see that the average change slightly below zero:1
I have wondered recently if my average change in weight is correlated with the day of the week. My hypothesis is that my weight tends to go up over the weekends, so I created a boxplot of my change in weight categorized by day.
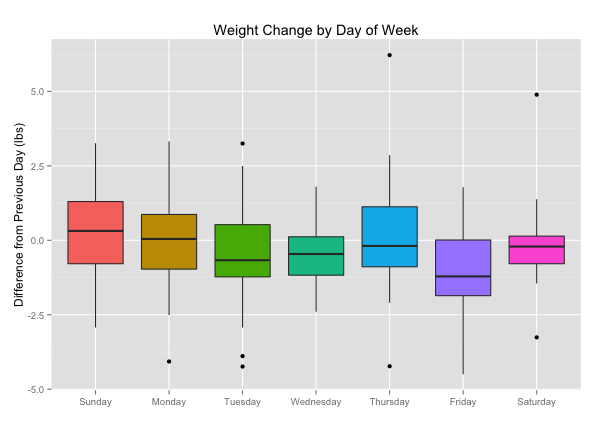
Indeed, on Sundays and Mondays (i.e. weight change from Saturday morning to Sunday morning and Sunday morning to Monday morning) my median weight change is slightly above zero. This makes sense to me: on Saturdays, I’m more likely to be doing things with friends, and thus I have less control over my meals.2
I wish I had a good explanation for why the change on Friday is so dramatic, but I don’t. Any guesses?