As I have notedbefore, body weight is a noisy thing. Day to day, your weight will probably fluctuate by several pounds. If you’re trying to lose weight, this noise can cause unfounded frustration and premature excitement.
When I started a serious weight loss plan a year and a half ago, I bought a wifi-enabled Withings Scale. The scale allows me to automatically sync my weight with Montior Your Weight, MyFitnessPal, RunKeeper, and other fitness apps on my phone. IFTTT also has great Withings support allowing me to push my weight to various other web services.
One IFTTT rule I have appends my weight to a text file in Dropbox. This file looks like this:
 1
 2
 3
 4
 5
 6
 7
 8
 9
10
263.86 August 21, 2014 at 05:56AM
264.62 August 22, 2014 at 08:27AM
264.56 August 23, 2014 at 09:41AM
263.99 August 24, 2014 at 08:02AM
265.64 August 25, 2014 at 08:08AM
267.4 August 26, 2014 at 08:16AM
265.25 August 27, 2014 at 09:08AM
264.17 August 28, 2014 at 07:21AM
264.03 August 29, 2014 at 08:43AM
262.71 August 30, 2014 at 08:47AM
For a few months, I have been experimenting with using this time series to give myself a less-noisy update on my weight, and I’ve come up with a decent solution.
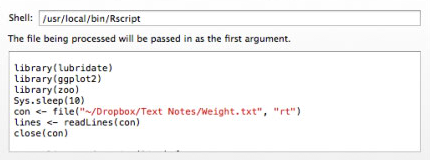
This R script will take my weight time series, resample it, smooth it with a rolling median over the last month, and write summary stats to a text file in my Dropbox. It’s not the prettiest script, but it gets the job done for now.1
INPUT_PATH<-"~/Dropbox/Text Notes/Weight.txt"OUTPUT_PATH<-"~/Dropbox/Text Notes/Weight Stats.txt"library(lubridate)library(ggplot2)library(zoo)# READ FILEcon<-file(INPUT_PATH,"rt")lines<-readLines(con)close(con)# PARSE INTO LISTS OF WEIGHTS AND DATESparse.line<-function(line){s<-strsplit(line,split=" ")[[1]]date.str<-paste(s[2:10][!is.na(s[2:10])],collapse=" ")date<-mdy_hm(date.str,quiet=TRUE)l<-list(as.numeric(s[1]),date)names(l)<-c("weight","date")l}list.weight.date<-lapply(lines,parse.line)weights<-lapply(list.weight.date,function(X)X$weight)dates<-lapply(list.weight.date,function(X)X$date)# BUILD DATA FRAMEdf<-data.frame(weight=unlist(weights),date=do.call("c",dates))# CREATE TIME SERIES AND RESAMPLEts<-zoo(c(df$weight),df$date)ts<-aggregate(ts,time(ts),tail,1)g<-round(seq(start(ts),end(ts),60*60*24),"days")ts<-na.approx(ts,xout=g)# FUNCTION TO GET WEIGHT N-DAYS AGO IF WEIGHT IS SMOOTHED BY ROLLING MEDIAN# OVER A GIVEN (smooth.n) NUMBER OF DAYSdays.ago<-function(days,smooth.n){date<-head(tail(index(ts),days+1),1)smoothed<-rollmedianr(ts,smooth.n)as.numeric(smoothed[date])}# SMOOTH WEIGHT BY 29 DAYS AND GENERATE SOME SUMMARY STATSdays=29current.weight<-days.ago(0,days)x<-c(current.weight,current.weight-days.ago(7,days),current.weight-days.ago(30,days),current.weight-days.ago(365,days),current.weight-max(ts))x=round(x,1)names(x)=c("current","7days","30days","365days","max")fileConn<-file(OUTPUT_PATH)w<-c(paste("Weight (lbs):",x["current"]),paste("Total Δ:",x["max"]),paste("1 Week Δ:",x["7days"]),paste("1 Month Δ:",x["30days"]),paste("1 Year Δ:",x["365days"]))writeLines(w,fileConn)close(fileConn)
The output looks something like this:
1
2
3
4
5
Weight (lbs): 265.7
Total Δ: -112
1 Week Δ: -0.8
1 Month Δ: -4.8
1 Year Δ: -75
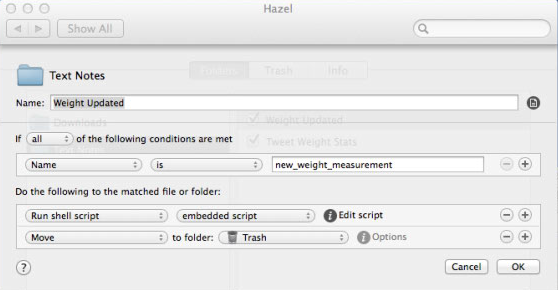
I want this script to be run every time my weight is updated, so I created a second IFTTT rule that will create a new file in my Dropbox, called new_weight_measurement, every time I weigh in. On my Mac Mini, I have a Hazel rule to watch for a file of this name to be created. When Hazel sees the file, it runs my R script and deletes that file.
My Hazel rule looks like this:
The ’embedded script’ that is run is the R script above; I just have to tell Hazel to use the Rscript shell.2
At this point, every time I step on my scale, a text file with readable statistics about my smoothed weight appear in my Dropbox folder.
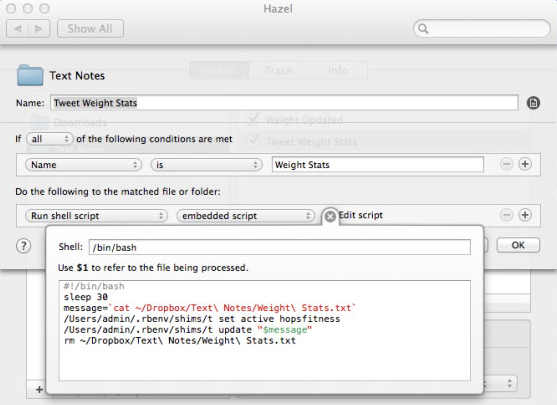
Of course, I want this updated information to be pushed directly too me. Hazel is again the perfect tool for the job. I have a second Hazel rule that watches for Weight Stats.txt to be created. Hazel can pass the path of the updated file into any script of your choice. You could, for example, use Mailgun to email it to yourself or Pushover to push it to your mobile devices. Obviously, I want to tweet mine.
I have a Twitter account called @hopsfitness where I’ve recently been tracking my fitness progress. On my Mac Mini, I have t configured to access @hopsfitness from the command line. Thus, tweeting my updated statistics is just a matter of a little shell script executed by Hazel:
Since this data goes to Twitter, I can get it painlessly pushed to my phone: Twitter still allows you subscribe to accounts via text message, which I’ve done with @hopsfitness. A minute or so after I step on my scale, I get a text with useful information about where I am and where I’m going; this is much preferable to the noisy weight I see on my scale.
Update (2014-12-06): I replaced my R script with a Python/pandas script. It requires Python 3 (to render the delta characters).